We decided to test some of these basic patterns to try and figure out if they even have the slightest statistical edge, meaning whether price pattern trading can produce a success rate higher than 50%
We studied 10 different patterns independently from one another in 5 different markets (Forex, Futures, Equities, Crypto and Bonds), for a time period of 22 months with more than 50 case studies for each and every single pattern
The results were rather shocking. Even though we suspected that we might not have the best-looking results (We drew that conclusion from the state of our trading performance, which back at the time, was dependent on these patterns), nothing could prepare us for this overly negative statistical picture.
Not even a single pattern had a success rate higher than 50%. In-fact, some patterns presented numbers lower than 40%, and only one pattern was somewhat close to the 50% mark with a success rate score of 48.6%. Very grim picture for price pattern trading, to say the least
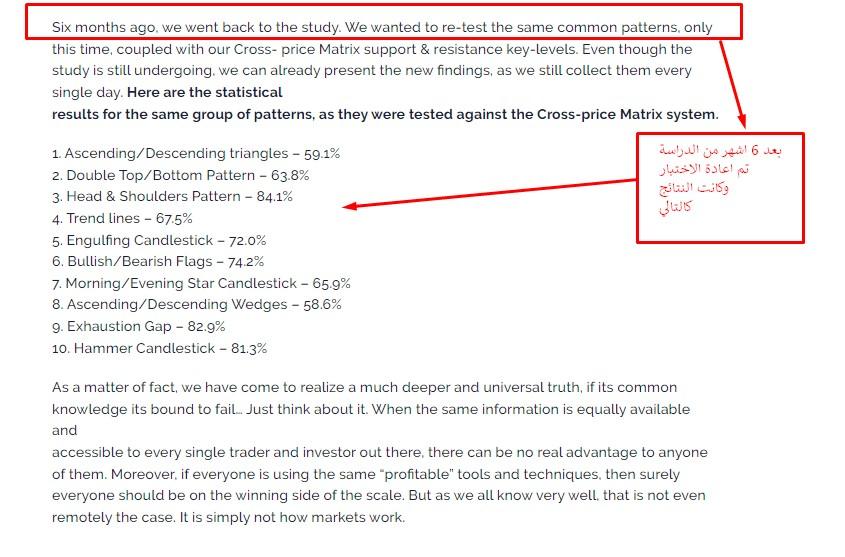
Here is the list of patterns that were involved in the study along with their respective success rates, as they were revealed in the two-year study
Ascending/Descending triangles – 39.5%
Double Top/Bottom Pattern – 41.2%
Head & Shoulders Pattern – 48.6%
Trend lines – 37.0%
Engulfing Candlestick – 42.7%
Bullish/Bearish Flags – 44.4%
Morning/Evening Star Candlestick – 45.9%
Ascending/Descending Wedges – 38.2%
Exhaustion Gap – 42.6%
Ha

er Candlestick – 45.5%


 رد مع اقتباس
مواقع النشر (المفضلة)